
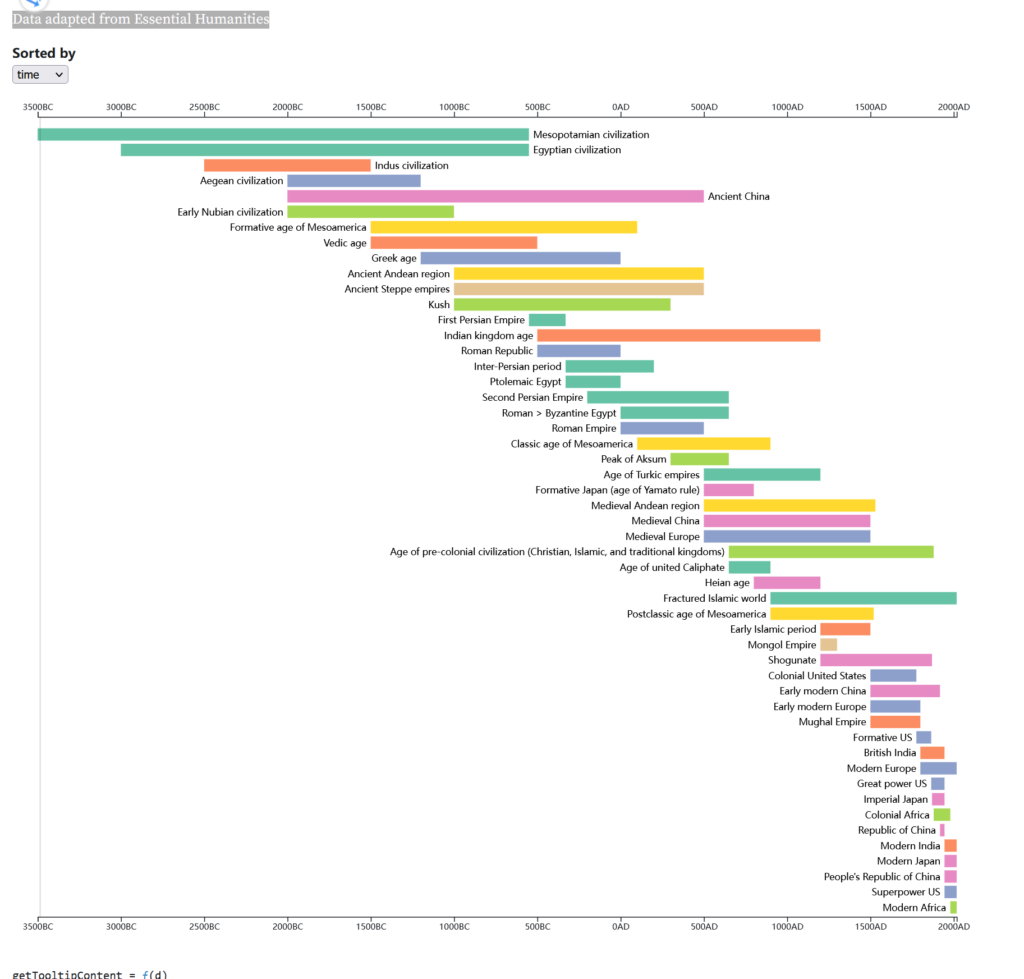
Data adapted from Essential Humanities
getTooltipContent = ƒ(d)
height = 1000
y = ƒ(i)
x = ƒ(n)
margin =
Object {top: 30, right: 30, bottom: 30, left: 30}
createTooltip = ƒ(el)
getRect = ƒ(d)
dataByTimeline =
Array(3) [Object, Object, Object]
dataByRegion =
Array(7) [Object, Object, Object, Object, Object, Object, Object]
axisBottom = ƒ(l)
axisTop = ƒ(l)
formatDate = ƒ(d)
d3 =
Object {event: null, format: ƒ(t), formatPrefix: ƒ(t, n), timeFormat: ƒ(t), timeParse: ƒ(t), utcFormat: ƒ(t), utcParse: ƒ(t), FormatSpecifier: ƒ(t), active: ƒ(t, n), arc: ƒ(), area: ƒ(), areaRadial: ƒ(), ascending: ƒ(t, n), autoType: ƒ(t), axisBottom: ƒ(t), axisLeft: ƒ(t), axisRight: ƒ(t), axisTop: ƒ(t), bisect: ƒ(n, e, r, i), bisectLeft: ƒ(n, e, r, i), …}
csv =
Array(51) [Object, Object, Object, Object, Object, Object, Object, Object, Object, Object, Object, Object, Object, Object, Object, Object, Object, Object, Object, Object, …]
data =
Array(51) [Object, Object, Object, Object, Object, Object, Object, Object, Object, Object, Object, Object, Object, Object, Object, Object, Object, Object, Object, Object, …]
regions =
Array(7) ["Middle East", "South Asia", "Europe (and colonial offshoots)", "East Asia", "Sub-Saharan Africa", "pre-colonial Americas", "the Steppe"]
timelines =
Array(3) ["ANCIENT WORLD", "MEDIEVAL WORLD", "MODERN WORLD"]
color = ƒ(i)
import {checkbox, select} from "@jashkenas/inputs"